How does Autarco calculate the expected yield?

How soon can you expect a return on your investment?
Renewable energy generated from natural sources such as wind and sun is a hot topic all over the world. After all, we all have to become more sustainable in order to achieve the set climate objectives. The government stimulates this process with, among other things, subsidies and a netting scheme. This ensures that more and more houses, businesses, schools and factory roofs are equipped with solar panels. In short, the solar energy sector is thriving. However, individuals and companies do not place solar panels on the roof purely for idealistic reasons. The initial investment in a solar power system must be recouped. Preferably as soon as possible!
How is an expected return calculated?
The installer’s quote states an expected return on an annual basis and an estimated payback period. There are several models to calculate this with different levels of accuracy. At its core, however, the expected return is based on:
- Historical weather data
- The slope and azimuth of the roof
- Shadow analysis
The historical weather data usually looks at data from the past 15 to 30 years and calculates an average from that. Add all these different factors together and it becomes quite a complicated calculation. Just because of the high degree of shade and a wide variety of roofs, there is often a considerable margin of error in this estimate.
The expected yield of your system is based on this long-term average, but due to annual variation in sunlight and temperature around this average, this can go up to +/-15%.
Very large projects typically make two types of yield estimates that take into account this variation in irradiance and other factors:
P50: The expected yield that will be achieved half the time
P90: The expected yield with 90% confidence.
Analysis of 20% of all utility projects in the US by kWh Analytics* shows that P90 production events, thus failing to achieve the stated efficiency, are actually three times more common than the P90 definition implies. The impact of these performance events on P90 is that the realized return is half lower than originally estimated.
Monitoring of current weather data is essential
While these P50 and P90 forecasts are useful for financial modeling prior to project construction, any reliable performance indicator needs to be adjusted to the weather once installed.
Why Autarco performance monitoring works better
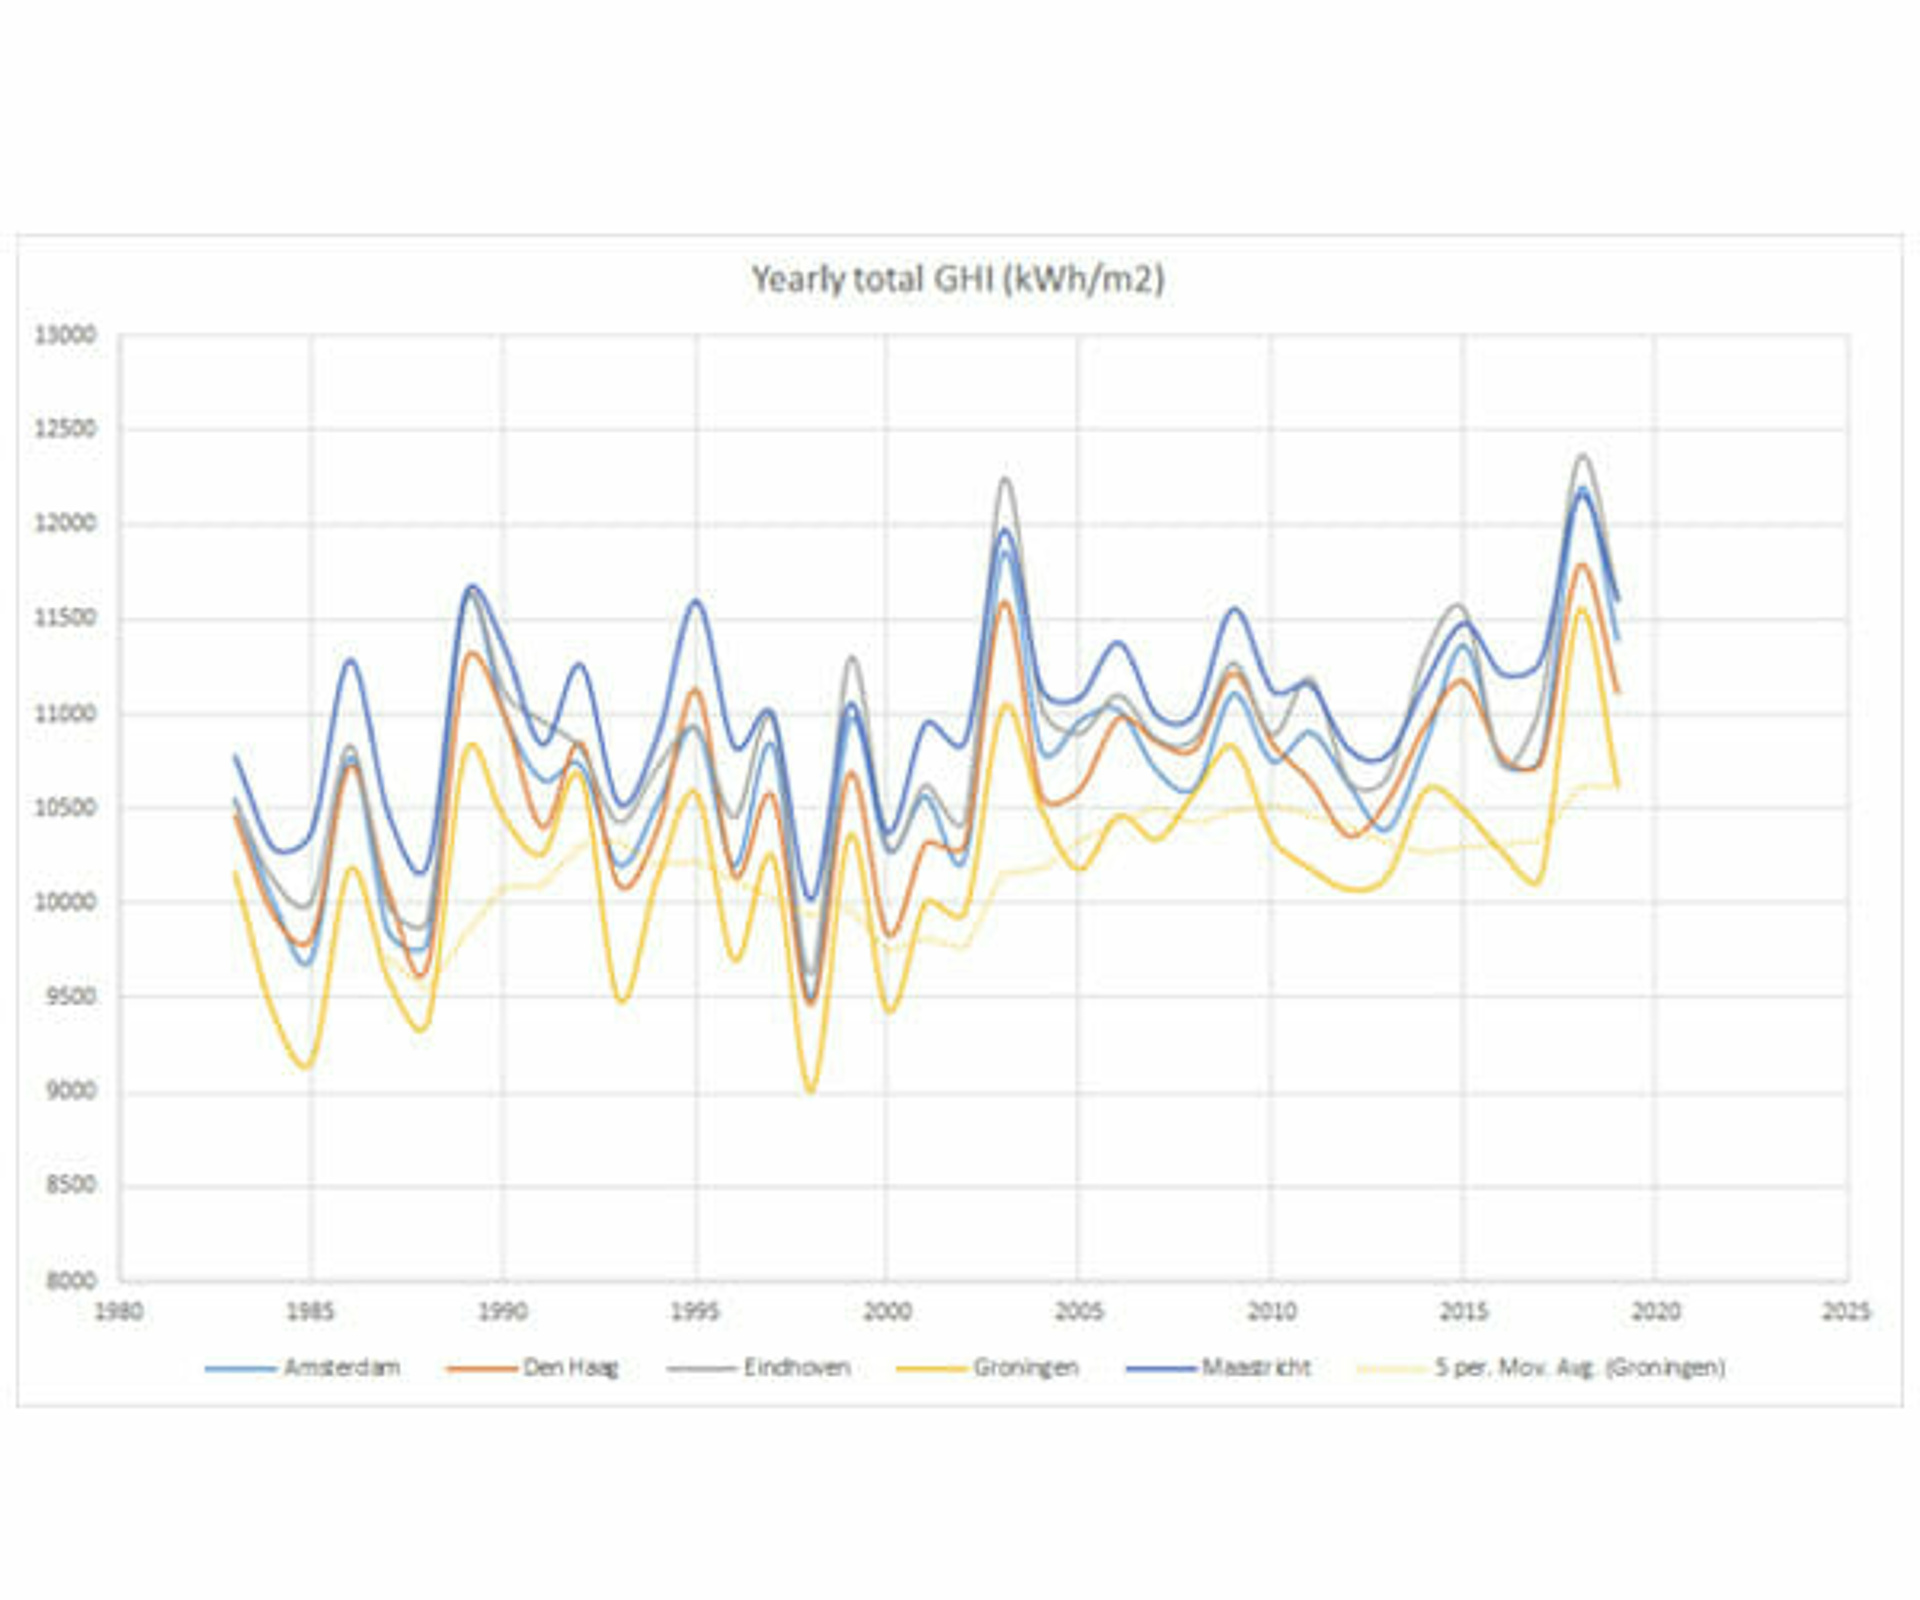
As you can see in the graph above, the Netherlands has had a higher irradiance in recent years compared to the historical average. Therefore, it is likely that underperformance of a solar power system will remain undiscovered. The system can achieve the expected yield stated in the quotation, but if it was an extremely sunny year, the system could even underperform by up to 15%.
At Autarco, we allow for some natural variation in modeling and data accuracy, and define any system that performs less than 95% of its weather-adjusted forecast as substandard.
Within the industry, weather-adjusted performance is measured through a metric called the “Energy Performance Index” (EPI). The EPI is also defined as the actual weather-corrected forecast of a solar power system.
This is where Autarco’s ‘Digital Twin’ and our data management skills make the difference. With other design software, the ‘digital copy’ is removed once the final quote and installation plans are generated. Our ‘Digital Twin’ remains active. We use this to verify the correct installation of the system and then to base the system’s performance on current weather data that we receive every 15 minutes for every square kilometer in Europe.
A monitoring portal only shows if a system is producing power, but does not provide a relevant benchmark for performance. That’s why Autarco’s kWh guarantee and weather-dependent performance monitoring are so important.
